IELTS Mate
Samples Writing
85 essays graded by AI
Pie chart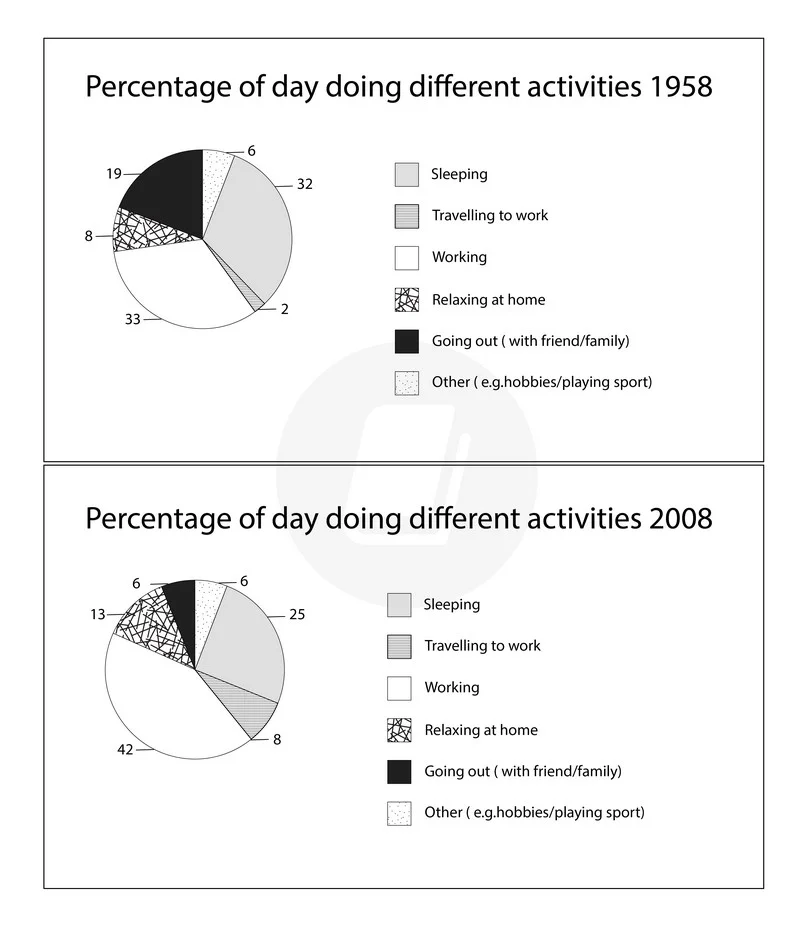
The chart below shows the percentage of the day working adults spent doing different activities in a particular country in 1958 and in 2008. Summarise the information by selecting and reporting the main features and make comparisons where relevant.
inbox
No samples for this band yet.