IELTS
Mate
menu
模範解答 Writing
notifications
模範解答 Writing
AI採点済み 360本
notifications
login
ログイン / 新規登録
Task 1
chevron_right
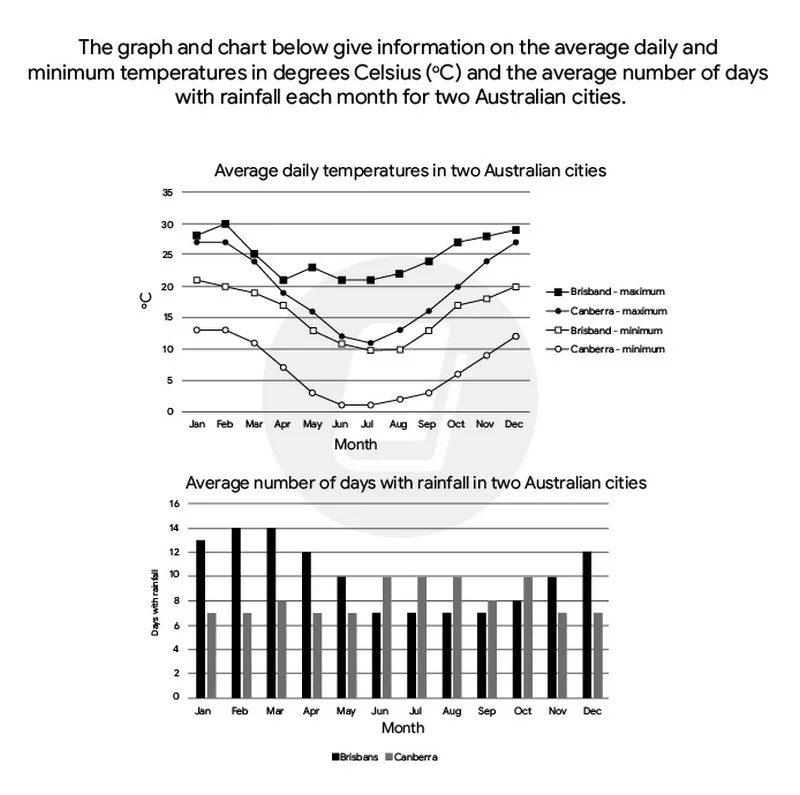
The graph and chart below give information on the average daily maximum and minimum temperatures in degrees Celsius and the average number of days with rainfall each month for two Australian cities. Summarise the information by selecting and reporting the main features and make comparisons where relevant
Line graph
以下のグラフとチャートは、2つのオーストラリア都市の平均日最高・最低気温(摂氏)と平均降雨日数に関する情報を示しています。主要な特徴を選択して報告し、関連する比較を行って情報を要約してください。
groups
共同練習に参加
Band 4
25本
Band 5
122本
Band 6
99本
lock
Band 7
98本
lock
Band 8
16本
inbox
このバンドの模範解答はまだありません。
さらに表示