IELTS
Mate
menu
模範解答 Writing
ログイン
模範解答 Writing
AI採点済み 184本
ログイン
Task 1
chevron_right
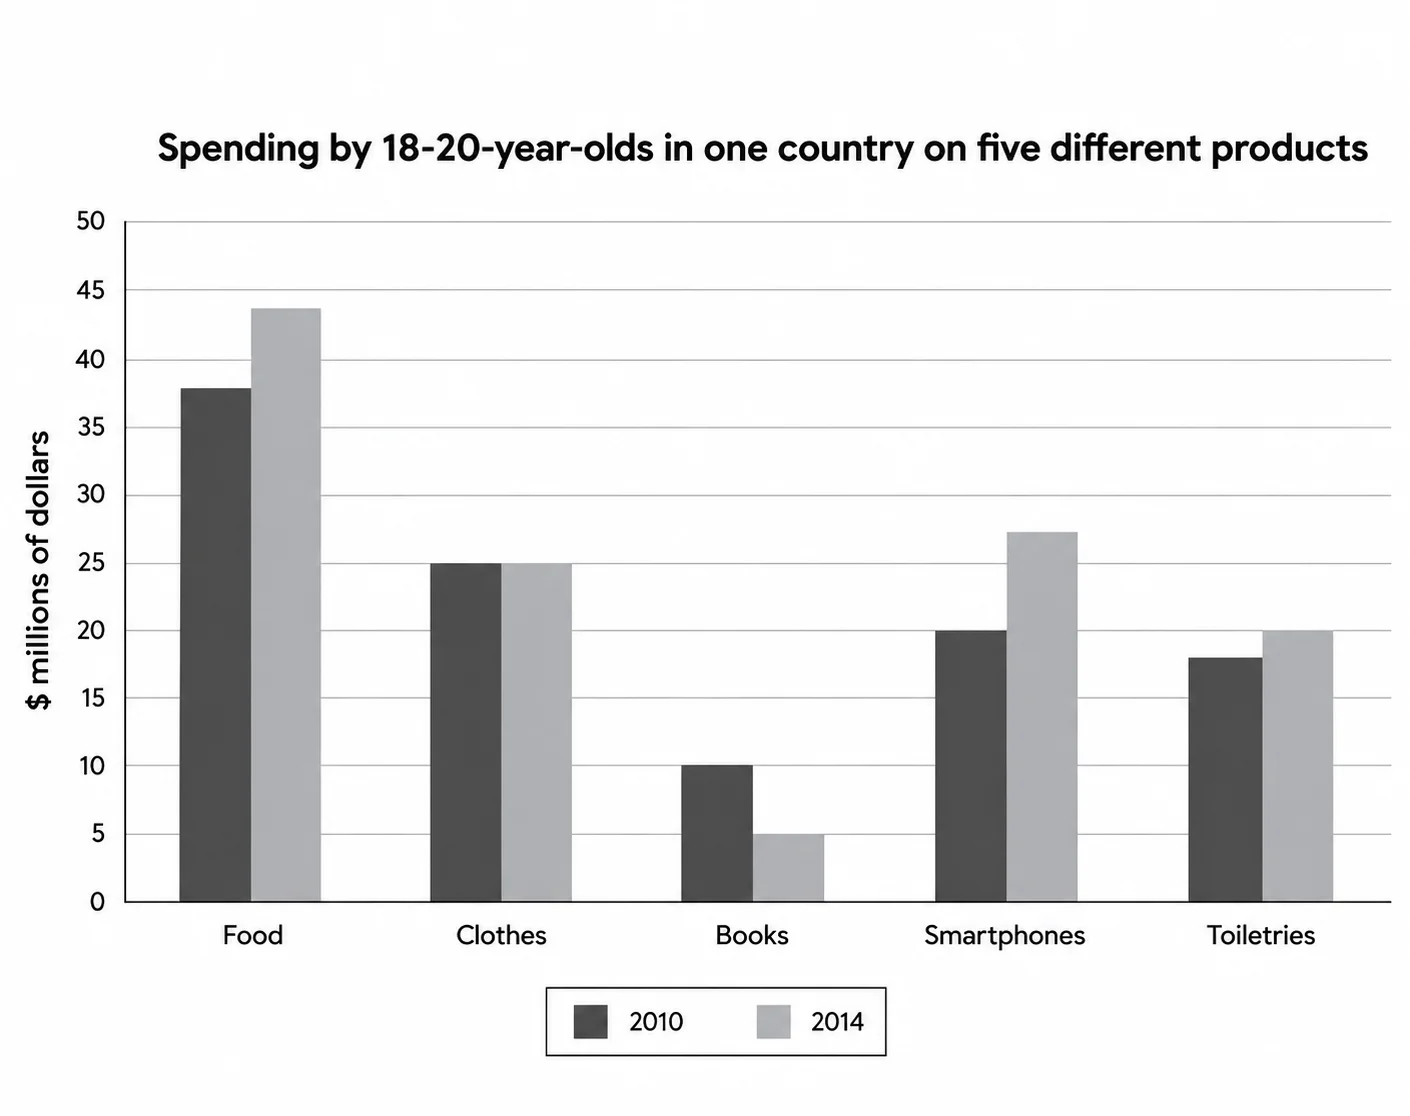
The chart below shows the spending by 18-20-year-olds in one country on five different products in 2010 and 2014. Provide an overview of the information by identifying and describing the key details, and include comparisons where appropriate.
Bar chart
下のグラフは、ある国の18-20歳の若者の5つの異なる製品への支出を2010年と2014年に示しています。主要な詳細を特定し説明することで情報の概要を提供し、適切な場合は比較を含めてください。
groups
共同練習に参加
Band 4
2本
Band 5
20本
Band 6
90本
lock
Band 7
70本
lock
Band 8
2本
inbox
このバンドの模範解答はまだありません。
さらに表示
 ログイン