IELTS
Mate
menu
模範解答 Writing
login
ログイン
模範解答 Writing
AI採点済み 151本
login
ログイン
Task 1
chevron_right
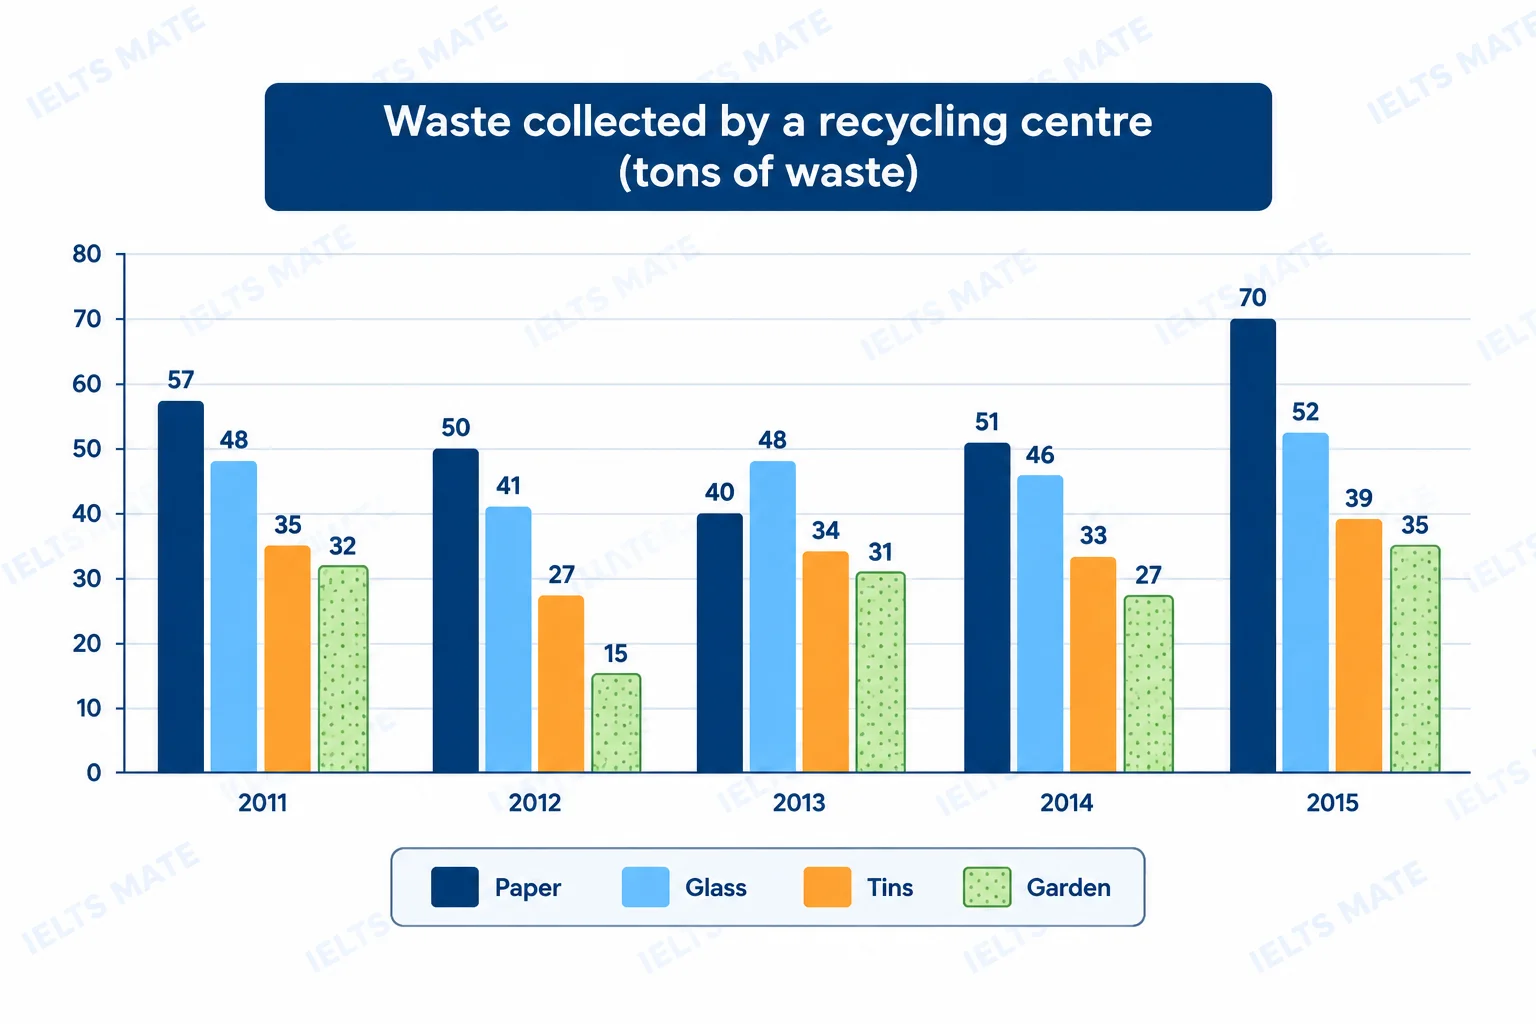
The chart below illustrates the amount of waste collected by a recycling centre between 2011 and 2015. Provide an overview of the information by identifying and describing the key details, and include comparisons where appropriate.
Bar chart
以下のグラフは、2011年から2015年までの間にリサイクルセンターによって回収された廃棄物の量を示しています。主要な詳細を特定し説明することで情報の概要を提供し、適切な比較を含めてください。
groups
共同練習に参加
Band 4
10本
Band 5
62本
Band 6
47本
lock
Band 7
27本
lock
Band 8
5本
4.5
138 語 · 2026年11月1日 に提出
arrow_forward
The bar chart illustrates how much waste collected including paper, glass, tins and garden by a recycling center from 2011 to 2015 measured tons of waste. Overall, the paper collected highest tons of waste in terms of among the four groups, while garden accounted for lowest…
さらに表示