IELTS
Mate
menu
模範解答 Writing
login
ログイン
模範解答 Writing
AI採点済み 119本
login
ログイン
Task 1
chevron_right
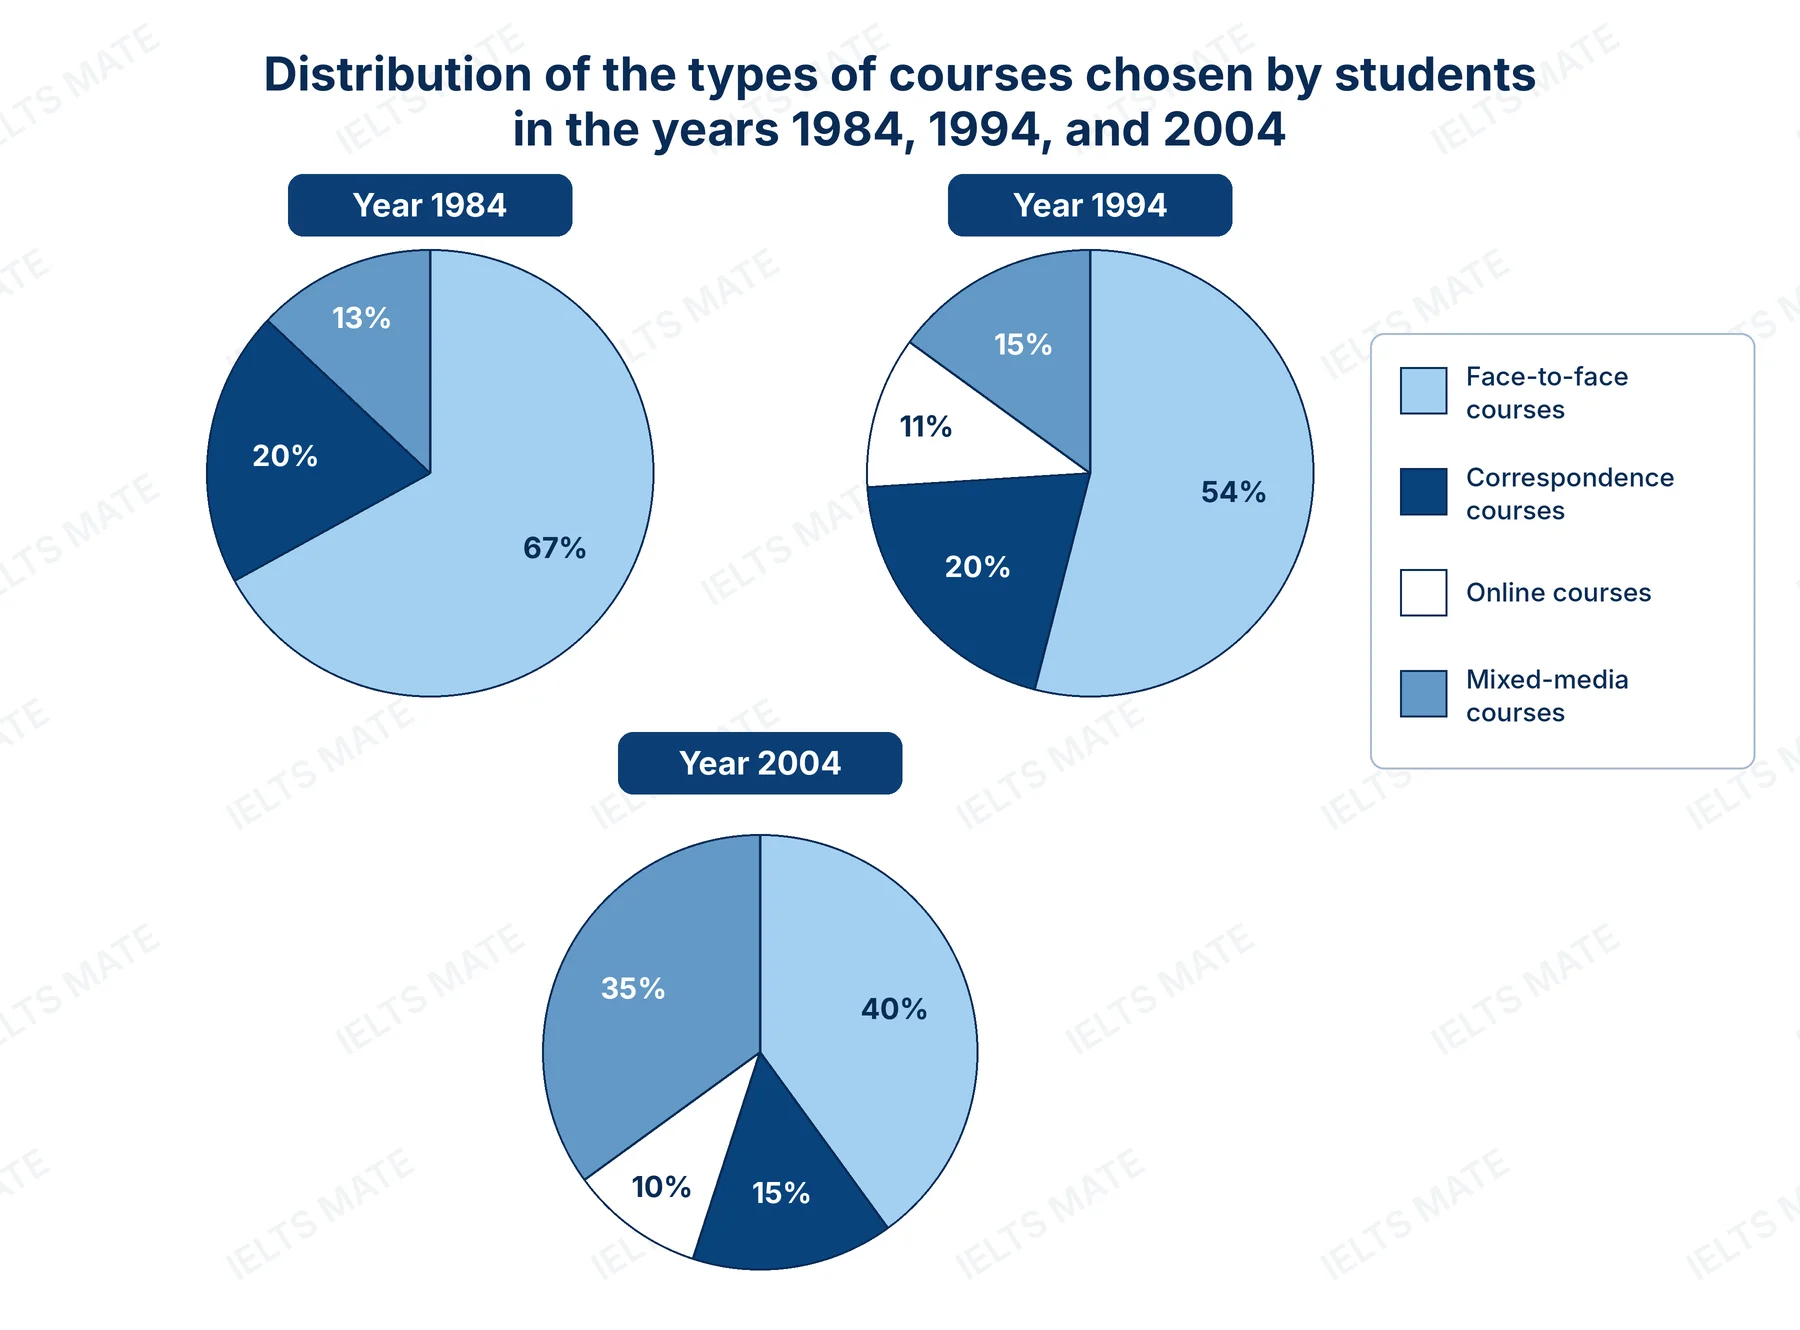
The pie charts illustrate the proportions of different course types chosen by students in the years 1984, 1994, and 2004. Provide an overview of the information by identifying and describing the key details, and include comparisons where appropriate.
Pie chart
円グラフは、1984年、1994年、2004年の学生が選んだ異なるコースタイプの割合を示しています。情報の概要を提供し、主要な詳細を特定して説明し、適切な比較を含めてください。
groups
共同練習に参加
Band 4
5本
Band 5
34本
Band 6
58本
lock
Band 7
19本
lock
Band 8
3本
inbox
このバンドの模範解答はまだありません。
さらに表示