IELTS
Mate
menu
模範解答 Writing
login
ログイン
模範解答 Writing
AI採点済み 233本
login
ログイン
Task 1
chevron_right
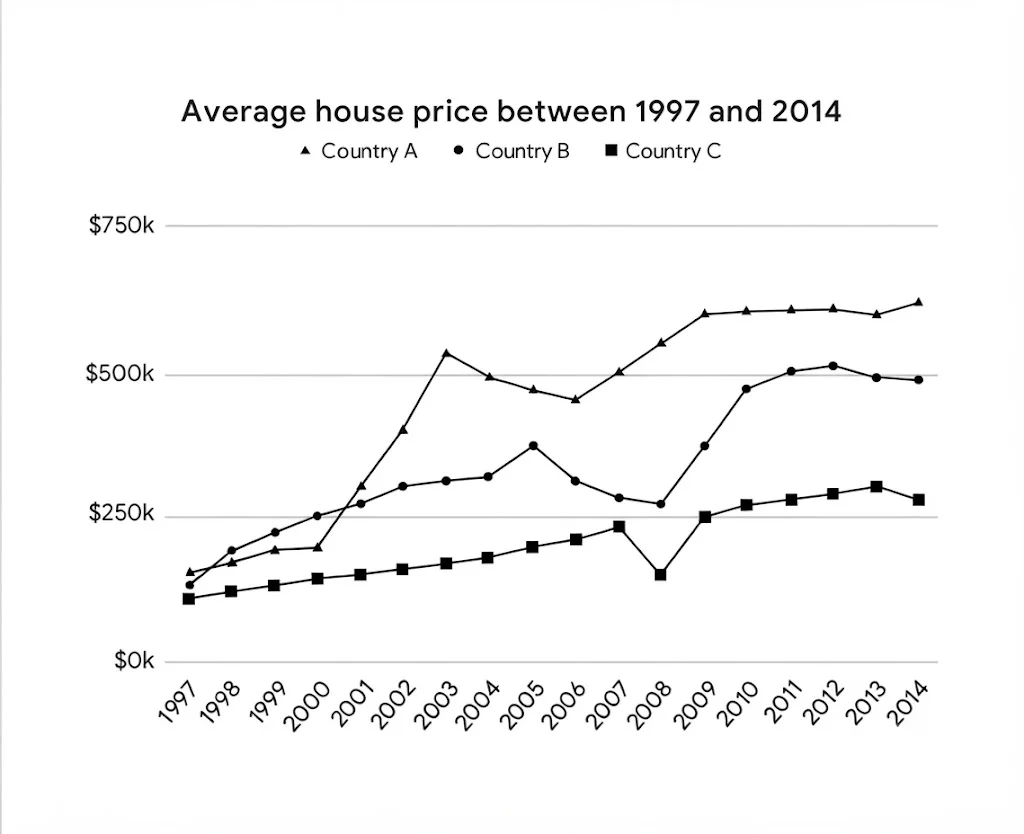
The graph below shows the average house prices in 3 countries between the years 1997-2014. Summarize the information by selecting and reporting the main features, and make comparisons where relevant.
Line graph
下のグラフは、1997年から2014年までの3か国の平均住宅価格を示しています。必要に応じて比較を行いながら、主要な特徴を選択して報告することで情報を要約してください。
groups
共同練習に参加
Band 4
7本
Band 5
81本
Band 6
106本
lock
Band 7
33本
lock
Band 8
6本
inbox
このバンドの模範解答はまだありません。
さらに表示