IELTS
Mate
menu
模範解答 Writing
模範解答 Writing
AI採点済み 95本
login
ログイン / 新規登録
Task 1
chevron_right
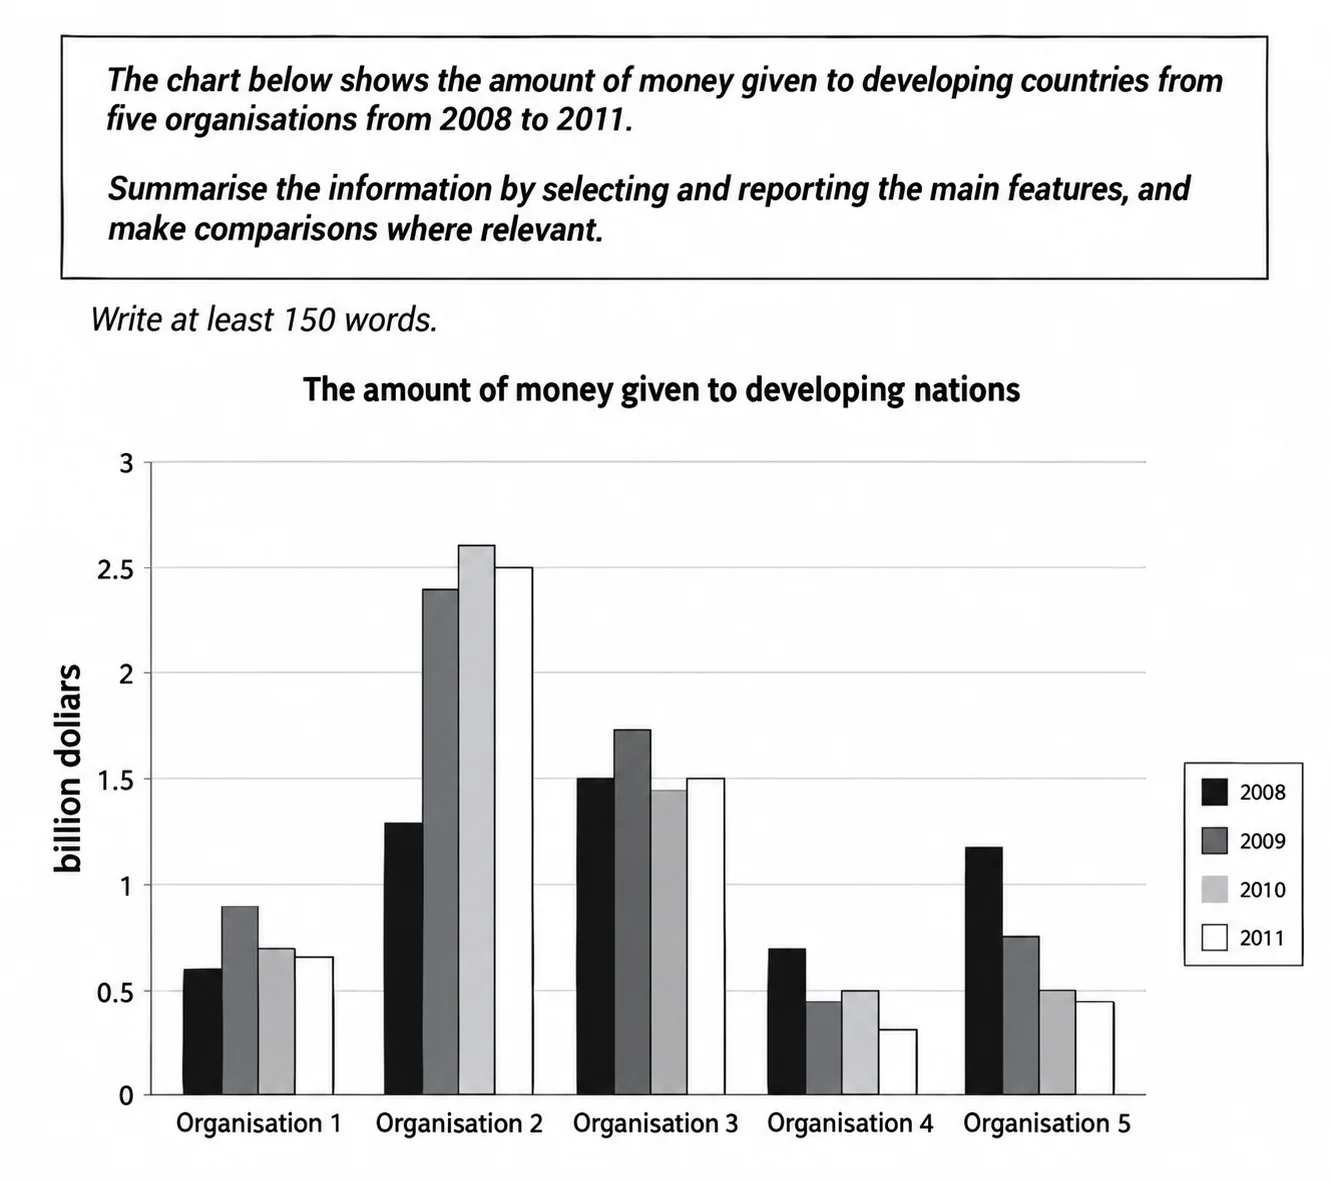
The chart below shows the amount of money given to developing countries from five organisations from 2008 to 2011. Summarise the information by selecting and reporting the main features, and make comparisions where relevant.
Bar chart
下のグラフは、2008年から2011年までの5つの組織から途上国に与えられたお金の量を示しています。主要な特徴を選択して報告し、関連する場所で比較を行って情報を要約してください。
groups
共同練習に参加
Band 4
10本
Band 5
44本
Band 6
34本
lock
Band 7
7本
inbox
このバンドの模範解答はまだありません。
さらに表示