IELTS Mate
模範解答 Writing
AI採点済み 91本
Bar chart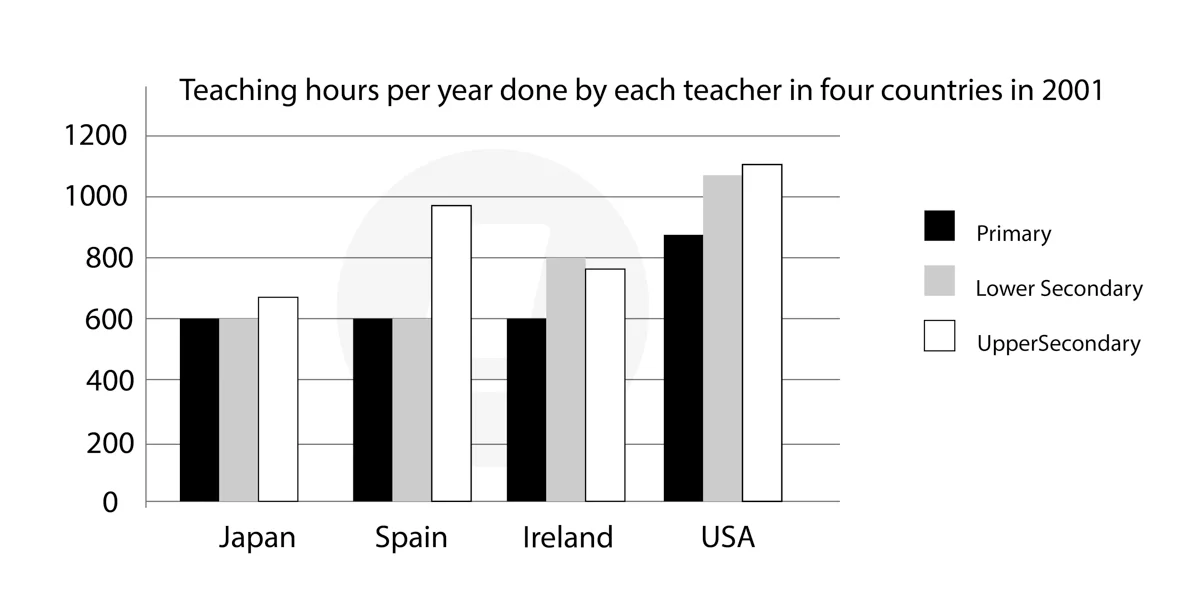
以下のグラフは、2001年に4つの異なる国で各教師が行った年間授業時間を示しています。関連する箇所で比較を行いながら、主要な特徴を選択して報告する形で情報を要約してください。
5.5201 語 · 2026年9月27日 に提出arrow_forwardThe graph demonstrates information about the annual teaching time that a teacher did in various countries in 2001. Overall, USA was a country that had the largest figure in all types of schools, including Primary, lower secondary and uppersecondary. Noticeably, it can be seen…5.5176 語 · 2026年9月27日 に提出arrow_forwardThe bar chart illustrates the educating hours of each teacher in four countries in 2001. Overall, while the time of teaching upper Secondary in USA lead the group, primary and lower Secondary in Japan and Spain and primary in Ireland recorded as the minor group. Significantly,…5.5179 語 · 2026年9月27日 に提出arrow_forwardThe bar chart illustrates the teaching hours annual done by teachers in four different countries including Japan, Spain, Ireland, USA in 2001. Overall, the teaching hours in Primary school was the lowest. While UpperSecondary experiences highest throughout these countries. The…