IELTS Mate
নমুনা লেখা
AI দ্বারা মূল্যায়িত 575 প্রবন্ধ
Line graph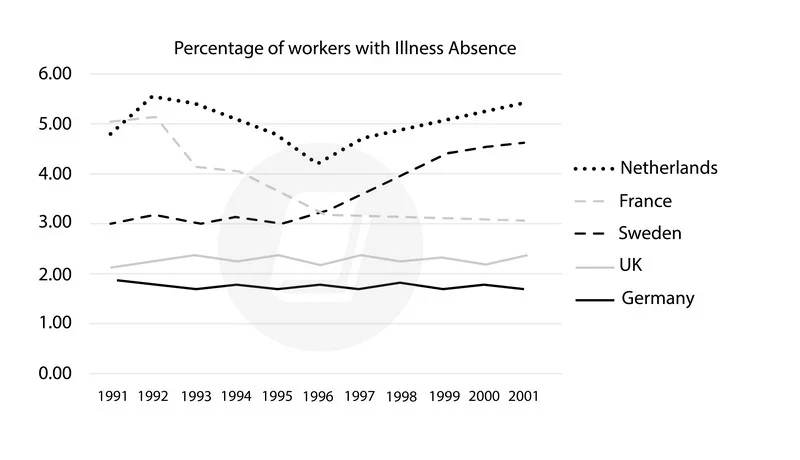
The graph below shows the percentage of workers from five different European countries that were absent for a day or more due to illness from 1991 to 2001.Summarise the information by selecting reporting the main features, and make comparisons where relevant.
inbox
এই ব্যান্ডের জন্য এখনও কোনো নমুনা পাওয়া যায়নি।